
mirror of https://github.com/wg-easy/wg-easy
You can not select more than 25 topics
Topics must start with a letter or number, can include dashes ('-') and can be up to 35 characters long.
1.4 KiB
1.4 KiB
| title |
|---|
| Prometheus |
To monitor the WireGuard server, you can use Prometheus and Grafana. The container exposes a /metrics/prometheus endpoint that can be scraped by Prometheus.
Enable Prometheus
To enable Prometheus metrics, go to Admin Panel > General and enable Prometheus.
You can optionally set a Bearer Password for the metrics endpoints. This is useful if you want to expose the metrics endpoint to the internet.
Configure Prometheus
You need to add a scrape config to your Prometheus configuration file. Here is an example:
scrape_configs:
    - job_name: 'wg-easy'
      scrape_interval: 30s
      metrics_path: /metrics/prometheus
      static_configs:
          - targets:
                - 'localhost:51821'
      authorization:
          type: Bearer
          credentials: 'SuperSecurePassword'
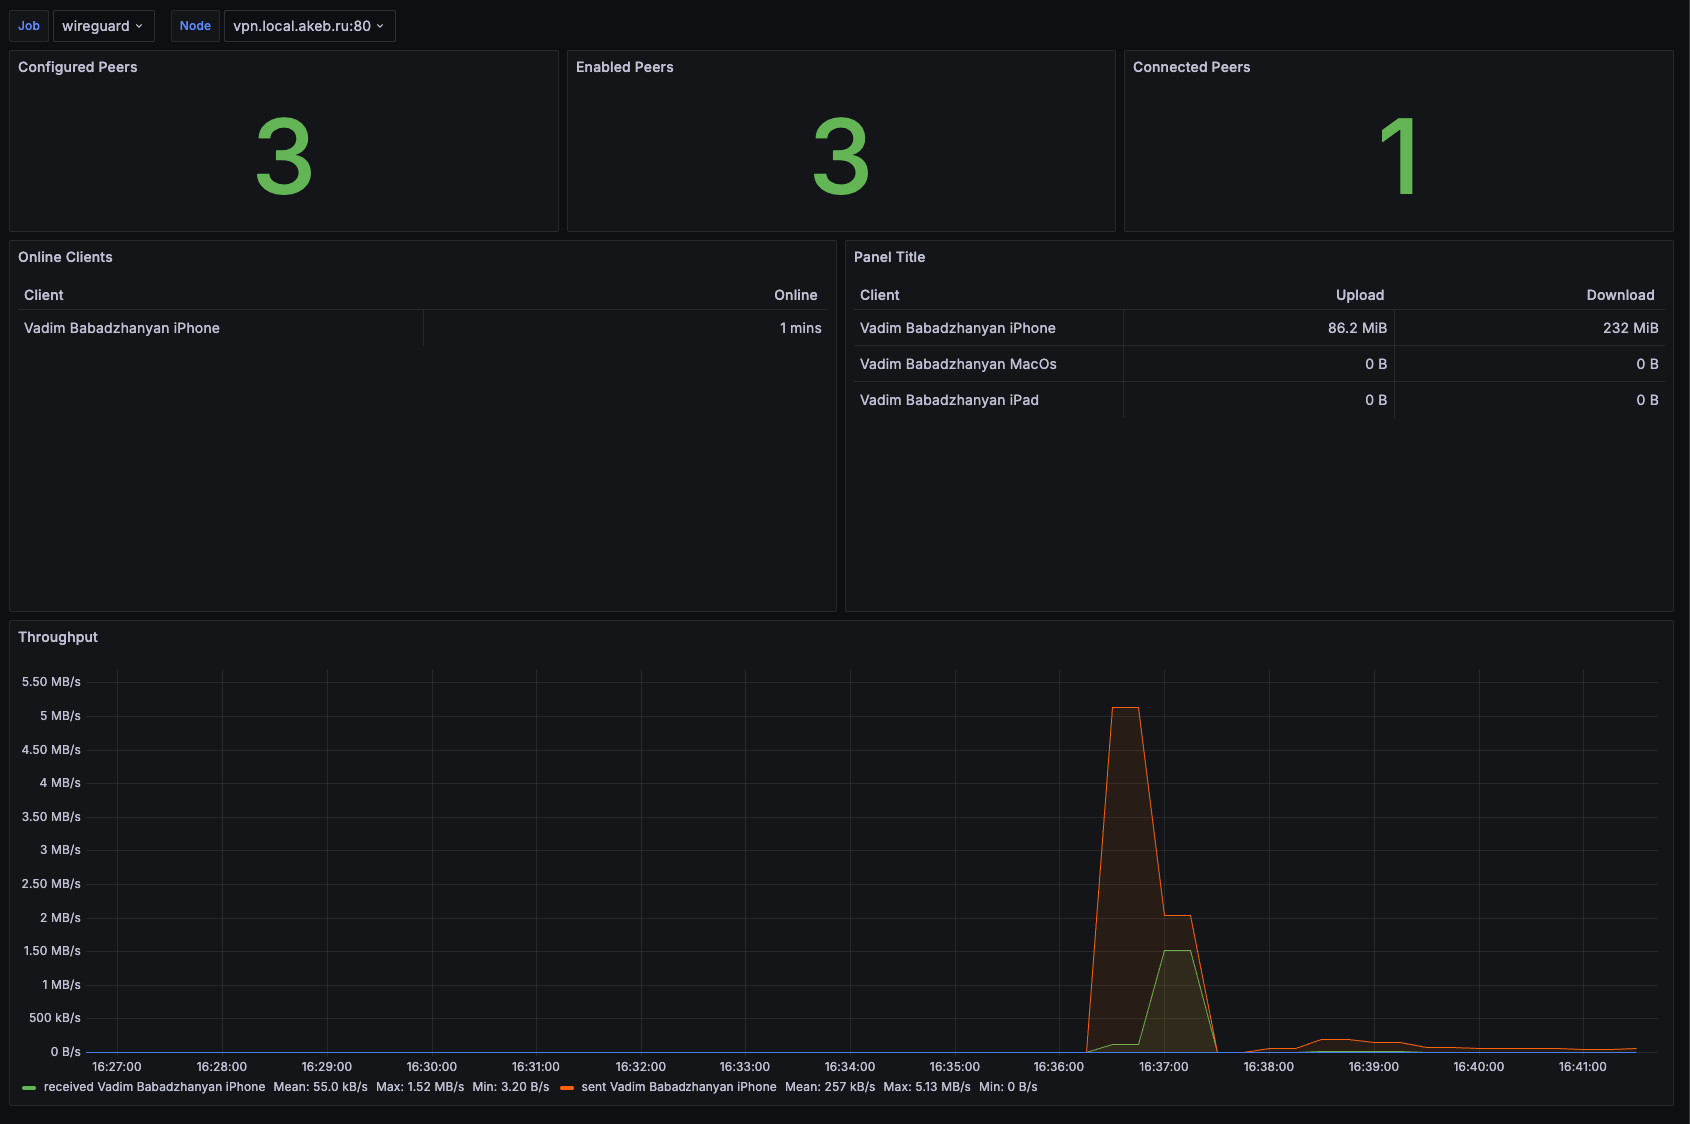
Grafana Dashboard
You can use the following Grafana dashboard to visualize the metrics:
!!! note "Unofficial"
The Grafana dashboard is not official and is not maintained by the `wg-easy` team. If you have any issues with the dashboard, please contact the author of the dashboard.
See [#1299](https://github.com/wg-easy/wg-easy/pull/1299) for more information.